
|
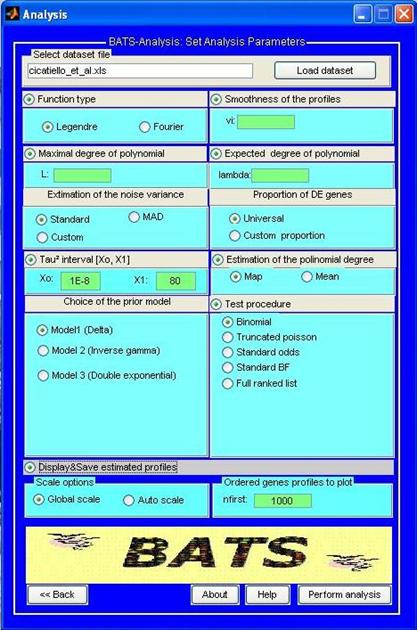
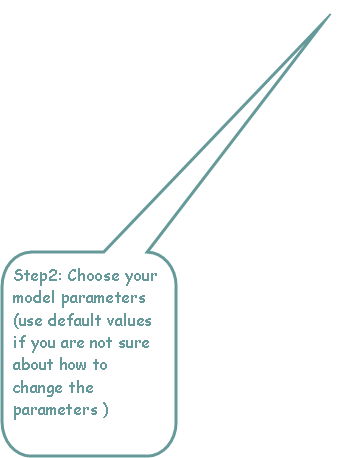
BATS-Analysis allows an user to apply the methodology described in Angelini, De Canditiis, Mutarelli & Pensky (2007) to either synthetic or real data-set. We observe that since BATS implements a truly functional approach, it is particularly suited for those time-course experiments where at least 5-6 time points are available, a larger number or arrays is recommendable. The software can also be used for analyzing shorter time course studies, but in this case no particular advantage is guaranteed with respect to simpler (regression based) approaches that can be more appropriate due to their simplicity. If the dataset does not meet the “minimum constraints” a warning message will advice the user that BATS is not suggested for the analysis of his experiment. Moreover version 1.0 of BATS is designed for the “one sample” experimental design. Future versions will also include the tools for the “two sample” design. Before carrying out the analysis we suggest the user to verify that the experiments can meet such constraint. The data can be analyzed with any of the three error type model (normal, Student T, double exponential) described in the above mentioned paper and additionally several data driven criteria for estimating the hyper-parameters are provided. Dataset to be analyzed have to be provided in the BATS input format (see also the user manual)
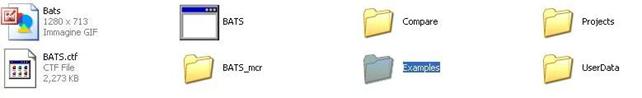
For sake of illustration the program contains in the folder Examples the normalized dataset of the human breast cancer experiment by Cicatiello et at (2004) in the BATS input format and its analysis is provided as guided example.
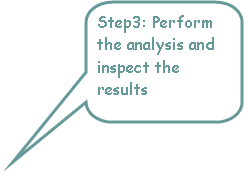
User dataset in the BATS input format can be saved in UserData (other folders are allowed) Output of the analysis will be contained (if not differently specified) in the folder Projects By default, three files are usually returned for each analysis the summary report of the analysis _SR.txt; the ordered list of significant genes _GL.xls (for windows user); the estimated _SH.xls (for windows user) genes’ profile. (Note that for Linux and Mac the output format xls is not supported and the output files will be provided in a .txt format, see the user manual for details) The figures of the expression profile for the most significant genes can be obtained as optional choice. Alternatively the estimated profile may be obtained by using the Plot profiles tool in Utilities |
|
A user friendly software for Bayesian Analysis of Time Series Microarray Experiments. |
|
Home page |
|
About Us |
|
Download BATS |
|
Description |
|
Tutorial |
|
Related Papers |
|
FAQ |
|
Acknowledgments |
|
Contact us |

|
Gene Name or Gene Id |
|
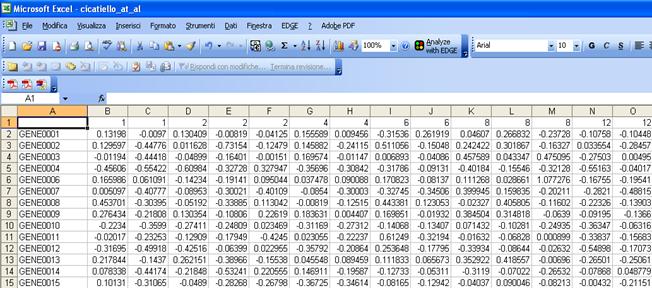
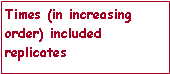
Data (normalized in log2 scale) and with empty cell or NaN for missing values |


|
Bayesian Analysis for Time Series Microarray Experiments |


|
For a short description of the statistical model implemented in BATS click here |