|
Note: It may happen that during the analysis, the terminal window will show some warning messages on the progression of the analysis.
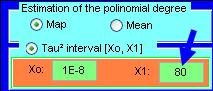
For example, a warning message (it will be reported also in the _SR.txt project output file) will be shown if the default range for parameter may be not appropriate. In such cases it may be convenient to increase the upper bound X1, additionally a _tau.ps plot is provided (inspection of such plot can be useful to understand how much seriously the warning have to be taken) |


|
Bayesian Analysis for Time Series Microarray Experiments |


|
Once all parameters have be set, the user can run the program by clicking on the button Perform analysis |

|
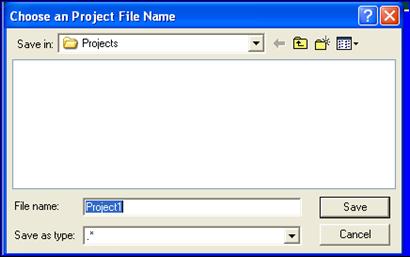
Then the user has to specify a Project name that will be used for saving results of the analysis.
By default, three files are usually returned for each analysis the summary report of the analysis _SR.txt; the ordered list of significant genes _GL.xls; the estimated _SH.xls gene profiles.
|

|
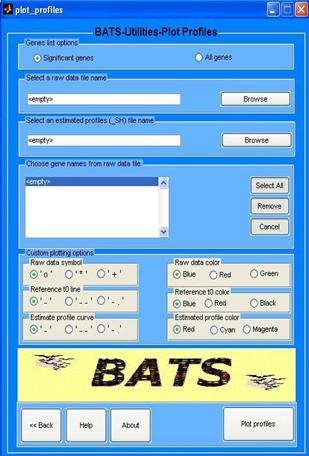
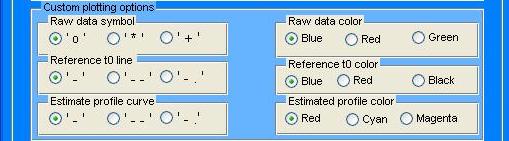
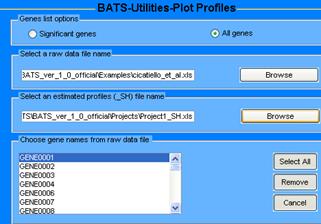
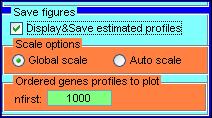
In the Analysis setting the user may choose to print out the estimated profiles of the top “nfirst” genes in the ranked ordered list an additional _profiles.ps file (containing the raw and estimated expression profiles) will be produced in the folder Project In alternative gene expression profiles can be generated using the Utility Plot Profiles |
|
A user friendly software for Bayesian Analysis of Time Series Microarray Experiments. |