
|
Before starting the analysis with BATS, data should already be pre-processed: normalized, log-transformed and probes with an excessive number of missing points should be filtered out. Data should also be in the BATS input data format. BATS contains the dataset Cicatiello_et_al.xls as an example. |
|
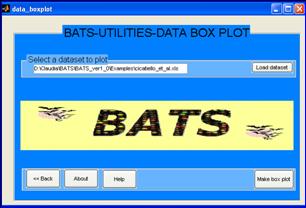
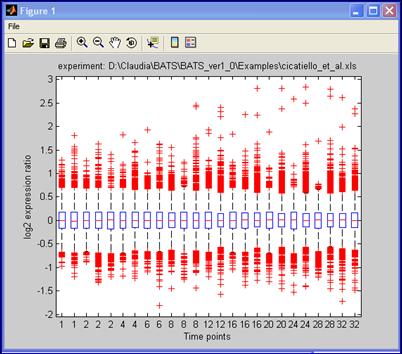
Load the cicatiello_et_al.xls data file (see biological data description) in the Data Box Plot window and click Make Box Plot. |
|
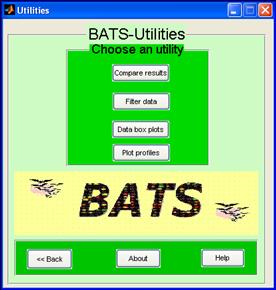
In the Utilities menu of BATS the function Data Box Plots can be used to inspect data before starting the analysis and check that it has been correctly pre-processed. |
|
The boxplot shows for each array the median of all values (central red lines) the range which covers 50% of values (blue boxes), the range which covers 75% of values (dashed black lines) and all the remaining individual values (red crosses). Normalized array values should have all the same median and approximately also the same range of 50% and 75% of values. |
|
A user friendly software for Bayesian Analysis of Time Series Microarray Experiments. |


|
Bayesian Analysis for Time Series Microarray Experiments |


|
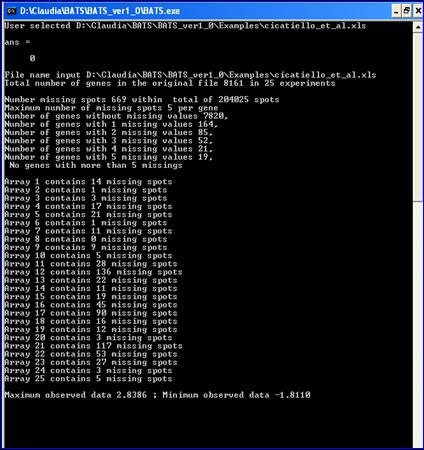
Additional information such as the total number of missing values, the number of missing values per gene and per array is printed in the dialog window |